


We studied public dealership reviews to understand which experiences shape customer perceptions and which themes recur or differ. An overall rating is tidy, which is handy for dashboards and less useful for understanding what customers describe across choosing, buying, and servicing a vehicle.
We collected publicly available reviews and discussions found online for dealerships in Philadelphia, Pennsylvania, United States, in October 2026. We did not establish when the reviews were published. We selected seven brands – Ford, Hyundai, Land Rover, Mercedes-Benz, Toyota, Tesla, and Volvo – to compare brands representing different regions of origin. We analyzed recurring themes only when at least two independent pieces of evidence supported them.
We distinguish three measures. Overall sentiment classifies an entire review. Claim-level sentiment classifies individual statements within reviews, which can point in different directions from the review as a whole. Negative-topic shares show how often a topic appears among negative reviews. These measures use different units and denominators. Our research traces recurring customer-experience signals within the local datasets, without turning varied accounts into a brand-wide conclusion.
Overall review sentiment across the researched datasets
Whole-review sentiment classifies each review overall. It does not identify the specific issue or experience described. In the analyzed Philadelphia-area dealership datasets, positive reviews made up 89.0% of reviews in the Ford dataset, while negative reviews made up 10.5% and neutral reviews 0.5%.
For Hyundai, 88.0% of reviews were positive, 11.5% negative, and 0.5% neutral. Land Rover’s dataset had 93.5% positive reviews, 6.5% negative reviews, and no neutral reviews. Mercedes-Benz had 98.0% positive reviews, 2.0% negative reviews, and no neutral reviews.
Tesla’s split was more mixed: 54.0% of reviews in its dataset were positive, 43.5% negative, and 2.5% neutral. Toyota had 85.0% positive reviews, 14.5% negative reviews, and 0.5% neutral reviews. Volvo had 90.0% positive reviews, 10.0% negative reviews, and no neutral reviews.
Within these datasets, Mercedes-Benz had the highest positive-review share and the lowest negative-review share. Tesla had the lowest positive share and the highest negative share. These differences describe the analyzed local samples, not the companies or their other dealerships. Overall review sentiment also differs from individual-claim sentiment and from the share of negative reviews mentioning a particular topic. A review’s overall tone does not by itself show what shaped it.
Sentiment within individual customer claims
Whole-review sentiment gives one overall label to a review. Claim-level sentiment classifies separate statements within it, so the two measures use different denominators and can show different balances.
Positive claims formed the majority in six of the seven local datasets. Their share ranged from 61.1% in the Toyota dataset to 82.9% in the Mercedes-Benz dataset. Ford, Hyundai, Land Rover, and Volvo also had more positive than negative claims, with positive shares of 71.2%, 66.9%, 72.9%, and 67.2%, respectively. Tesla’s dataset differed: 39.5% of its claims were negative and 35.0% positive.
Mercedes-Benz had the highest positive-claim share and the lowest negative-claim share among the datasets: 82.9% of claims were positive and 5.2% negative. Tesla had the highest negative-claim share. Toyota’s negative share was 18.2%, below Tesla’s 39.5% and above the shares in the other five datasets. Neutral claims ranged from 11.8% in Mercedes-Benz to 25.5% in Tesla.
These percentages describe the mix of individual claims, not the share of reviews or customers with a positive or negative experience. A review can contain several statements, so claim-level sentiment shows the balance of favorable, neutral, and critical points without replacing the review’s overall sentiment. These local dealership datasets do not establish brand-wide performance or explain why the claim mixes differ. Read claim-level sentiment alongside whole-review sentiment and negative-topic shares. The measures capture different aspects of the feedback.
Complaint topics across the researched datasets
Negative reviews in all seven supplied Philadelphia-area dealership datasets mention claims problem resolution. The share ranges from 17.2% among negative reviews in the Tesla dataset to 50.0% in the Mercedes-Benz dataset. The Mercedes-Benz share comes from a particularly small negative-review group and warrants caution.
The topic appears in 19.0% of negative reviews in the Ford dataset, 30.4% in Hyundai, 30.8% in Land Rover, 34.5% in Toyota, and 20.0% in Volvo. These figures describe the analyzed local datasets, not every customer or an entire brand.
Other complaint topics vary. Product or service quality appears in 46.2% of negative reviews in the Land Rover dataset, compared with 6.9% in Toyota’s. This is a descriptive contrast between local datasets, not a brand-wide quality judgment. Sales-onboarding concerns appear in 18.4% of negative reviews in Tesla’s dataset and 17.4% in Hyundai’s. Speed or efficiency concerns appear in 26.1% of Hyundai’s negative reviews.
Customer support appears in 27.6% of Toyota’s negative reviews and 21.8% of Tesla’s. These topic percentages use negative reviews as their denominator. A negative review can describe more than one issue. Problem resolution recurs across the supplied local datasets, while topic shares describe specific complaints rather than overall sentiment or a provider ranking.
Top positive patterns by company
Favorable descriptions of service or customer service appear among the leading positive patterns in all seven local dealership datasets, though their wording and rank vary. Customer-service praise ranks second for Ford, third for Hyundai, first for Mercedes-Benz, third for Toyota, and second for Volvo. Tesla’s second-ranked positive pattern concerns favorable service evaluations.
Among reviews in the respective local datasets, customer-service praise ranges from 9.0% for Hyundai to 12.0% for Mercedes-Benz. Tesla’s positive service-evaluation pattern appears in 8.5% of reviews. Volvo’s customer-service pattern appears in 10.5% of reviews, Toyota’s in 9.5%, and Ford’s in 11.0%.
The leading patterns differ in emphasis. Mercedes-Benz’s top positive pattern is customer service, followed by accounts of a process that did not feel pressuring and then a generally favorable experience. Land Rover’s top three patterns describe positive dealership and service experiences in broad terms. Ford’s top three combine favorable mentions of a person, general customer-service praise, and a positive overall experience.
Hyundai’s top two patterns describe favorable interactions with a person mentioned in the feedback. Each appears in 3.5% of reviews. Broader customer-service praise ranks third and appears in 9.0%. Volvo’s leading pattern also concerns a person mentioned. It appears in 8.0% of reviews, compared with 10.5% for its customer-service pattern. Pattern order reflects how often each theme appeared in individual claims, while these percentages describe the share of reviews containing a pattern.
Positive service descriptions recur across these local samples, alongside broader praise and favorable accounts of particular interactions in some datasets. These patterns are positive signals, not measures of overall service quality or rankings of companies.
Top negative patterns by company
Across the seven supplied local dealership datasets, negative patterns range from broad dissatisfaction to service concerns, a specific repair issue, and unease about the buying process. Pattern order reflects how often each theme appeared in individual claims. The percentages describe the share of reviews containing each pattern, a different measure.
In the Ford dataset, the leading pattern was a generally negative experience, appearing in 5.5% of reviews. Concerns that service or prices were costly appeared in 2.5%, while a negative dealership-choice pattern appeared in 1.0%. Hyundai also had a broad negative-experience pattern, in 5.5% of reviews. Descriptions of the service department as unprofessional and statements of reluctance to return to the brand each appeared in 2.5%.
Poor customer-service descriptions led in the Tesla dataset, appearing in 9.5% of reviews. Two other leading patterns also criticized service, at 8.5% and 7.0%. Toyota’s leading concerns were dissatisfaction with dealing with or visiting the dealership (7.0%) and with the service received (5.0%). Land Rover’s leading patterns were overall dissatisfaction (3.5%) and concern about service quality (3.0%).
The Mercedes-Benz summary lists a daunting buying experience as its leading negative pattern, found in 2.5% of reviews. Its shorter list does not establish that other concerns were absent. In Volvo’s dataset, a tire-related problem led at 4.0%, followed by negative views of future dealings with the local dealership at 2.0%. These findings describe different reported friction points in specific local datasets, not comparable measures of overall company performance or claims about entire brands.
What the combined findings reveal
Our study selected six brands—Ford, Toyota, Hyundai, Mercedes-Benz, Volvo, and Land Rover—to compare brands representing different regions of origin. The supplied Philadelphia-area datasets cover seven cohorts, including Tesla. The available material does not explain the difference, so we treat Tesla as a supplied local dataset without inferring why it was included.
Whole-review sentiment contrasts across the analyzed datasets. In the Tesla dataset, 54.0% of reviews were positive and 43.5% negative. In the Mercedes-Benz dataset, 98.0% were positive and 2.0% negative. Toyota’s dataset had 85.0% positive reviews and 14.5% negative reviews. These figures describe local samples, not the manufacturers or their other dealerships.
Individual claims produce a different balance because they count statements rather than whole reviews. In the Tesla dataset, 39.5% of claims were negative and 35.0% positive. In the Mercedes-Benz dataset, 5.2% were negative and 82.9% positive. A review can contain several claims with different sentiments, so claim shares need not match review-level shares.
Problem resolution recurs in negative-review findings for all seven datasets. Among negative reviews, the topic appeared in 50.0% of the Mercedes-Benz dataset, 34.5% of Toyota’s, 30.8% of Land Rover’s, 30.4% of Hyundai’s, 20.0% of Volvo’s, 19.0% of Ford’s, and 17.2% of Tesla’s. A negative review can describe multiple issues, so these topic shares are not additive.
Product or service quality appeared in 46.2% of negative reviews in the Land Rover dataset, compared with 6.9% in Toyota’s. Positive customer-service descriptions appeared in 12.0% of reviews in the Mercedes-Benz dataset, 11.0% of Ford’s, 9.5% of Toyota’s, and 8.5% of Tesla’s. These are review-level shares. Overall review sentiment, claim sentiment, and negative-topic shares describe different parts of local dealership experiences. They do not rank companies or branches.
Ford: positive and negative experiences
In this Philadelphia-area Ford dealership dataset, the leading positive patterns concern favorable experiences with a person mentioned, customer service, and the dealership overall. The person-focused pattern appeared in 11.5% of reviews, while favorable customer-service and overall-experience patterns each appeared in 11.0%.
Positive sales onboarding also stands out. It appeared in 71.3% of positive reviews in this dataset. That is a share of positive reviews, not all reviews, and measures something different from the whole-review patterns above.
The leading negative pattern identified was a broadly unfavorable experience, found in 5.5% of reviews. Comments describing service or prices as costly appeared in 2.5%, and a negative dealership-choice pattern appeared in 1.0%. Among negative reviews in this dataset, 23.8% raised pricing value, while 19.0% mentioned claims problem resolution. Customer support and product or service quality also each appeared in 19.0% of negative reviews.
Whole-review sentiment was positive for 89.0% of reviews, while 71.2% of individual claims were positive. A review can contain several claims, so claim-level shares describe individual statements rather than the overall tone. Positive sales and service accounts coexist with concerns about cost and problem resolution in this local dataset. These findings do not describe Ford dealerships generally.
Hyundai: positive and negative experiences
In this local Hyundai dataset, 88.0% of reviews were positive, 0.5% neutral, and 11.5% negative. The claim-level picture was also more positive than negative: 66.9% of claims were positive, 16.2% negative, and 16.9% neutral. These measures use different units. A review gives an overall assessment. Individual claims separate its assertions, so a positive review can still include criticism.
The top-ranked positive patterns include praise for a person’s conduct or interaction during the process, each found in 3.5% of reviews. Customer-service praise ranks next and appears in 9.0% of reviews. A favorable view of the deal’s price or value also appears among the leading positive patterns, in 9.0% of reviews. Pattern order reflects how often each theme appeared in individual claims, while these percentages use reviews as their denominator.
The leading negative pattern describes an overall disappointing experience, found in 5.5% of reviews. Other top patterns describe perceived unprofessionalism in the service department and an intention not to choose Hyundai again. Each appeared in 2.5% of reviews. Among negative reviews, problem resolution is the most prominent listed topic at 30.4%. Speed and efficiency follows at 26.1%, and sales onboarding at 17.4%. A negative review can describe more than one issue, so these topic shares need not add up to 100%.
Positive service signals coexist with critical accounts of the experience and concerns about problem resolution in this local dataset. These patterns describe feedback in this dataset, not Hyundai dealerships generally.
Land Rover: positive and negative experiences
In this Philadelphia-area Land Rover dataset, leading positive patterns describe broadly favorable experiences rather than distinct steps in a customer. A positive experience appeared in 10.5% of reviews, a great or excellent service experience in 10.5%, and a positive overall experience in 11.0%.
Whole-review sentiment was positive for 93.5% of reviews, negative for 6.5%, and neutral for none. Among individual claims, 72.9% were positive, 12.3% negative, and 14.9% neutral. The measures can differ because a review can contain claims with different sentiments, including a negative or neutral observation within a positive overall review.
The leading negative pattern identified describes a deeply unsatisfactory overall experience, found in 3.5% of reviews. Concern about service quality follows at 3.0%. A recurring description of perceived carelessness or inattention to detail appears in 1.5% of reviews. The pattern summaries also include repeated visits to address the same issue, another problem-resolution signal, in 1.5% of reviews.
Positive overall sentiment dominates the whole-review measure, while negative summaries point to service execution and unresolved issues as sources of dissatisfaction. These patterns describe this local dataset, not every Land Rover dealership or a ranking against other cohorts.
Mercedes-Benz: positive and negative experiences
In this local Mercedes-Benz dealership dataset, the leading positive patterns concern customer service, a buying process described as not pressuring customers, and broadly favorable experiences. They appear in 12.0%, 11.5%, and 11.0% of reviews, respectively.
Customer service leads the positive patterns by the frequency of supporting claims, followed by the more specific account of customers not feeling pressured. The third pattern is a general favorable assessment rather than a specific service or sales detail. These are review-level shares, not percentages of individual claims.
The leading negative pattern identified describes buying a car as potentially daunting. It appears in 2.5% of reviews in this dataset.
The positive pattern about a low-pressure process contrasts with accounts of a daunting buying experience. The available pattern summary identifies the latter as its leading negative theme, but does not establish that other kinds of negative experience were absent.
Positive service and low-pressure sales descriptions coexist with reports of a daunting purchase process in this local dataset. These are separate reported signals. The evidence does not establish that one caused the other or that they characterize Mercedes-Benz dealerships beyond this dataset.
Tesla: positive and negative experiences
In this local Tesla dataset, 54.0% of reviews were positive, 43.5% negative, and 2.5% neutral. At the claim level, 35.0% of claims were positive, 39.5% negative, and 25.5% neutral. A review can contain several claims with different sentiments, so claim shares describe individual statements rather than overall review judgments.
The leading positive patterns focus on service: 8.0% of reviews describe the service experience as great, while 8.5% evaluate service positively and another 8.5% express a positive view of Tesla or the experience. Separate positive-topic findings identify customer support and sales onboarding as notable parts of positive reviews.
The leading negative patterns identified concern service: 9.5% of reviews describe customer service as poor, 8.5% describe service as poor, and 7.0% criticize customer service. Among negative reviews, 21.8% mention customer support, 18.4% sales onboarding, and 17.2% claims problem resolution. A negative review can describe more than one issue, so these topic shares are not additive.
Positive accounts include service and sales-process experiences. Negative patterns repeatedly criticize service and point to difficulties with support and problem resolution. These findings describe this analyzed Tesla dealership dataset, not Tesla dealerships or the brand as a whole. They do not establish why customers encountered the reported experiences.
Toyota: positive and negative experiences
In the Toyota dealership dataset for Philadelphia, positive feedback most often centered on service and the overall dealership experience. Each of the two leading service-related patterns appeared in 9.5% of reviews, while a broadly positive assessment of the dealership appeared in 9.0% of reviews.
The negative patterns describe another part of the experience. Dissatisfaction with dealing with or visiting the dealership appeared in 7.0% of reviews, while dissatisfaction with the service received and general dissatisfaction each appeared in 5.0%. These broad pattern labels do not specify an incident or explain why a customer was dissatisfied.
Problem resolution appeared in 34.5% of negative reviews in the Toyota dataset. Customer support appeared in 27.6% of negative reviews, while trust and transparency appeared in 13.8%. A negative review can cover more than one issue, so these topic shares are not additive.
Favorable descriptions of service coexist with reported dissatisfaction and problem-resolution concerns in this local dataset. Pattern percentages describe reviews, while claim-level sentiment describes individual statements. Neither measure alone captures every point in a customer’s account. These findings concern the analyzed Toyota dealership dataset in Philadelphia, not Toyota dealerships or the brand as a whole.
Volvo: positive and negative experiences
In the supplied Philadelphia-area Volvo dealership dataset, positive feedback concerns customer service, favorable impressions of the dealership, and praise for a person mentioned in reviews.
Among reviews in this dataset, 10.5% describe customer service positively, 8.5% describe the dealership positively, and 8.0% praise the person mentioned. These review-level shares differ from claim-level measures.
A tire-related problem is the leading negative pattern, appearing in 4.0% of reviews in this dataset. Negative views of future dealings with the dealership appear in 2.0% of reviews, while accusations of dishonesty appear in 1.5%. Separately, problem resolution appears in 20.0% of negative reviews. This adds a service-recovery signal to the tire-related pattern without establishing what caused the problem or how it was handled.
Positive assessments of service and the dealership sit alongside complaints about a product-related issue, future dealings, and trust. These are distinct patterns, not a single verdict on the customer experience. The local Volvo findings describe this dataset only. Review-level pattern shares and claim-level measures capture different things.
What the findings add up to
Problem resolution appears repeatedly in negative reviews across the seven local Philadelphia-area dealership datasets. It appeared in 19.0% of Ford’s negative reviews, 30.4% of Hyundai’s, 30.8% of Land Rover’s, 50.0% of Mercedes-Benz’s, 17.2% of Tesla’s, 34.5% of Toyota’s, and 20.0% of Volvo’s. These shares describe negative reviews within each dataset. They do not rank companies or branches.
Positive service descriptions also recur across the supplied datasets, alongside critical accounts of service. Positive customer-service patterns appear in 11.0% of reviews in the Ford dataset, 9.0% in Hyundai, 12.0% in Mercedes-Benz, and 8.5% in Tesla. These are review-level shares, not claim-level percentages. The evidence supports recurring signals around problem resolution and service. It does not establish one common pattern across every customer-the person mentioned stage in all seven datasets.
The measures capture different parts of the feedback. In the Tesla dataset, 43.5% of reviews were negative and 54.0% positive. Negative claims made up 39.5% of its individual claims and positive claims 35.0%. A review can contain several distinct statements, so whole-review sentiment and claim-level sentiment need not match. Neither measure is the same as the share of negative reviews mentioning a particular topic.
The six-brand selection—Ford, Toyota, Hyundai, Mercedes-Benz, Volvo, and Land Rover—was designed to compare brands representing different regions of origin. The supplied local datasets include those six and Tesla. The available materials do not explain why the selection and dataset counts differ. Findings for each analyzed dealership dataset remain local and should not be generalized to its entire brand.
This study does not rank companies or their branches. It helps companies identify reported gaps in product and service quality so they can improve them.
Figures come from the analyzed public-review datasets. Overall review sentiment and sentiment within individual claims use separate denominators.
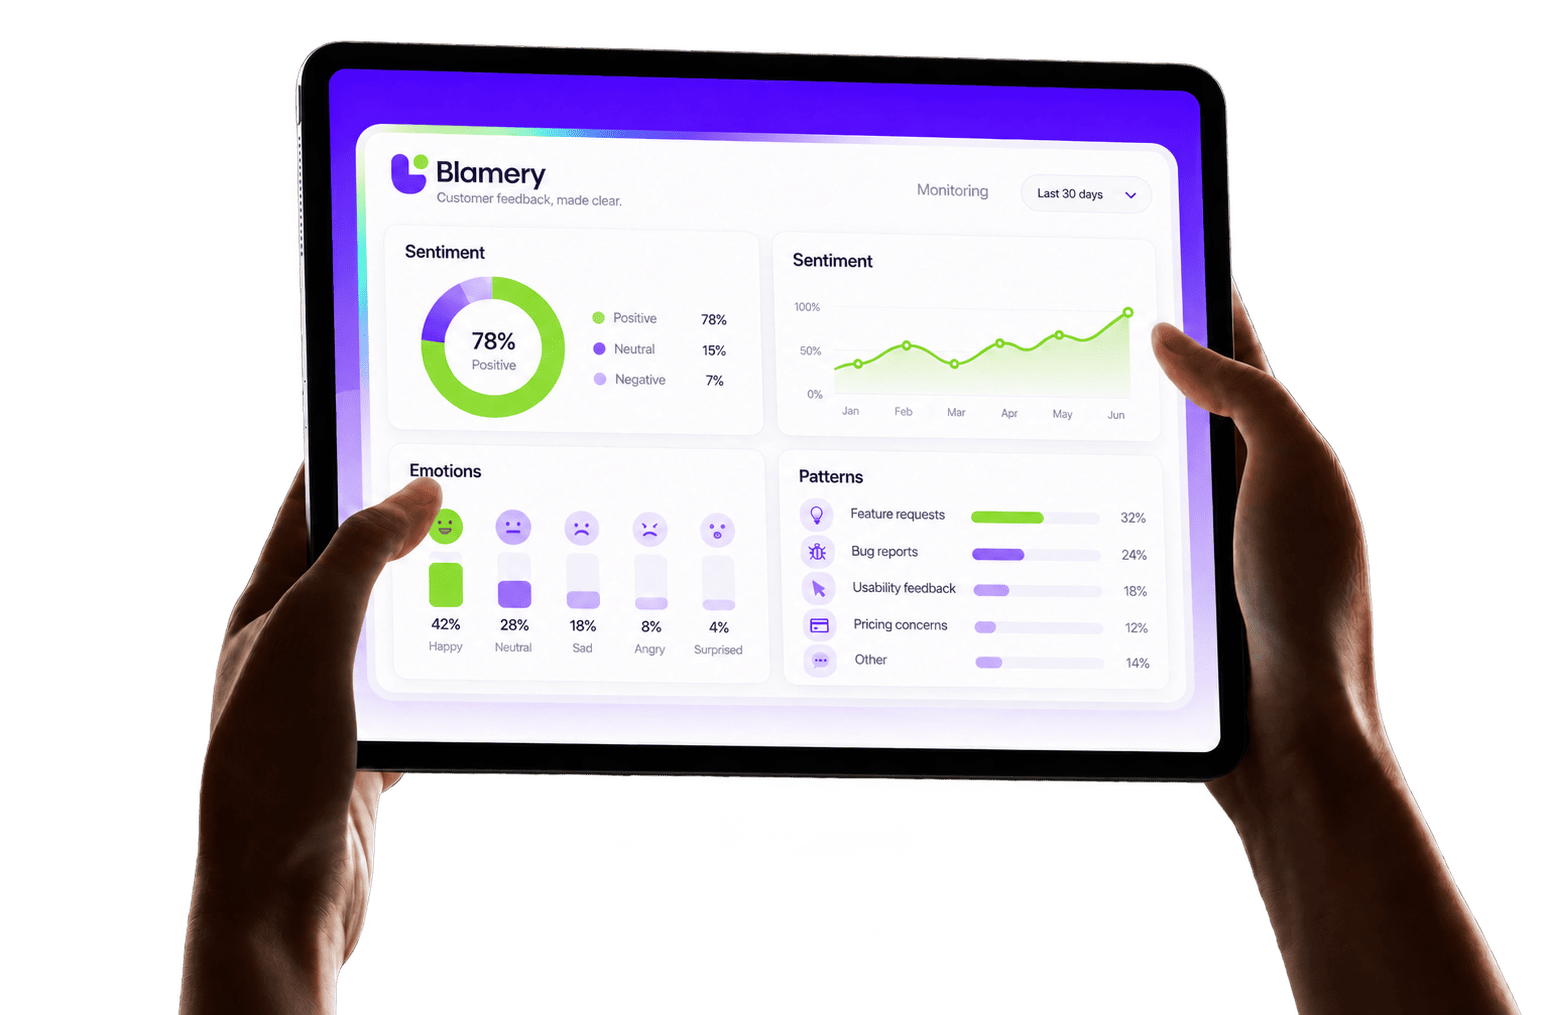
Blamery can run sentiment analysis and identify positive and negative patterns in public online feedback about your company or product, as well as competing companies or products. Explore the free demo, or contact us for custom marketing research.