


We set out to understand the experiences that shape customer perceptions of car rental companies serving Boston Logan International Airport. We collected publicly found online reviews in November 2026. We selected companies for which we found at least 3,000 reviews about car rental services at Boston Logan International Airport. We analyzed the eligible company datasets using both whole-review sentiment and sentiment in individual claims.
The six researched companies are Alamo Rent A Car, Avis Car Rental, Budget Car Rental, Enterprise Rent-A-Car, Hertz Car Rental, and National Car Rental. We did not establish when the reviews were published or how the analyzed subsets were sampled.
A whole review gets one overall sentiment label, while an individual review can contain several claims, including both positive and negative points. These measures answer different questions about customer feedback.
Overall review sentiment across the researched datasets
Whole-review sentiment varies across the six company datasets. The percentages in this section describe the share of reviews in each dataset assigned to each sentiment.
In the Alamo Rent A Car dataset, 84.0% of reviews were positive, 2.5% neutral, and 13.5% negative. Avis Car Rental’s reviews were 87.0% positive, 0.5% neutral, and 12.5% negative. Budget Car Rental’s reviews were 11.5% positive, 2.0% neutral, and 86.5% negative. Enterprise Rent-A-Car’s reviews were 83.0% positive, 1.5% neutral, and 15.5% negative. Hertz Car Rental’s reviews were 44.5% positive, 1.5% neutral, and 54.0% negative. National Car Rental’s reviews were 81.9% positive, 0.5% neutral, and 17.6% negative.
Avis had the largest positive-review share in these datasets, at 87.0%. Budget had the smallest, at 11.5%. Budget also had the largest negative-review share, 86.5%, while Avis had the smallest, 12.5%. Neutral reviews made up no more than 2.5% of any dataset. The lowest neutral share was 0.5%, in the Avis and National datasets.
Sentiment within individual customer claims
Claim-level sentiment classifies individual claims rather than assigning one sentiment to an entire review. A review can include both favorable and unfavorable points, so claim shares give a different view of the feedback. They are percentages of classified claims, not of reviews or customers.
Positive claims made up 68.7% of classified claims in the Avis dataset, the largest share among the six datasets. Budget had the smallest positive share, at 12.8%. Alamo, Enterprise, and National had positive-claim shares between 60.3% and 60.9%. Hertz’s share was 29.9%.
Budget had the largest negative-claim share, at 61.3%, followed by Hertz at 45.5%. The other four datasets ranged from 16.1% to 19.1%. Alamo had the smallest share, at 16.1%. Neutral claims ranged from 12.7% in Avis to 25.9% in Budget.
These claim shares show a different mix of favorable and unfavorable points from the whole-review results. They describe classified claims in the analyzed datasets, not population-wide performance or the cause of any difference.
Complaint topics across the researched datasets
The percentages in this section are the shares of negative reviews in each company dataset assigned a named topic. They describe the mix of complaints, not each company’s overall rate of negative reviews.
Service pace varied across the datasets. The speed-and-efficiency topic appeared in 48.0% of negative reviews in the Avis dataset, 27.7% in Budget, and 18.5% in Hertz. Its share was 7.4% in Alamo and 5.7% in National. No Enterprise negative reviews in this dataset were assigned that topic.
Problem resolution appeared in 22.0% of Budget’s negative reviews, 20.4% of Hertz’s, and 20.0% of National’s.
These categories describe reported concerns, not their causes or population-wide performance. A negative review can describe more than one issue. Whole-review sentiment alone does not show which concerns recur within each company dataset.
Top positive patterns by company
The leading positive patterns differ across the company datasets. They include reports of clean vehicles and easy returns, as well as favorable service impressions and smooth processes. Pattern rankings reflect the relative frequency of themes among classified claims. The percentages here describe the share of reviews mentioning each pattern.
For Alamo Rent A Car, the most frequently ranked positive themes were reviewers saying they would rent again, in 18.5% of reviews, and describing the car as clean, in 17.0%. Favorable staff impressions appeared in 9.5%. Avis Car Rental’s leading pattern was positive customer-service feedback, mentioned in 13.5% of reviews. Its next two ranked patterns were more individualized positive mentions, each in 3.5% of reviews.
Budget Car Rental’s three leading entries focus on the vehicle. Reviews said it was fine or had no issues, or described it positively. Each pattern appeared in 5.0% of reviews. Smooth drop-off appeared in 4.0%. Easy returns appeared in 13.0% of Enterprise Rent-A-Car reviews and 13.6% of National Car Rental reviews. National’s other leading patterns were clean cars, in 12.1% of reviews, and positive service impressions, in 11.1%. Enterprise’s second and third patterns were positive rental experiences, in 12.0% of reviews, and favorable overall assessments, in 9.5%.
For Hertz Car Rental, favorable staff impressions and descriptions of a smooth process each appeared in 6.5% of reviews. Broadly good experiences appeared in 8.0%. The different rankings and review shares capture the particular touchpoints customers mentioned, rather than a single verdict on the rental.
Top negative patterns by company
Leading negative patterns range from broad dissatisfaction and service delays to complaints about vehicle condition. The pattern order reflects the relative frequency of themes among classified claims. Percentages describe the share of reviews in each company dataset mentioning a pattern. These are different measures.
In the Budget Car Rental dataset, delays getting a usable car appeared in 10.0% of reviews, just above dirty-car reports at 9.5%, although dirt ranked higher by claim frequency. A strongly negative overall assessment appeared in 7.5% of reviews. Avis Car Rental’s leading patterns included long lines, in 8.0% of reviews, and strong dissatisfaction or general dissatisfaction, each in 5.5%.
Alamo Rent A Car’s leading listed pattern was general dissatisfaction, in 6.5% of reviews. Windshield-wiper problems and streaking each appeared in 1.5%. Enterprise Rent-A-Car’s leading pattern concerned receiving an unexpected vehicle, in 3.5% of reviews. Inadequate wipers appeared in 2.0%, and a tire issue in 1.5%.
Hertz Car Rental’s leading listed concerns were a poor overall experience, in 8.0% of reviews, poor vehicle condition, in 7.5%, and unacceptable customer service, also in 7.5%. National Car Rental’s leading patterns included a rental-car issue, in 7.0% of reviews, low tire pressure, in 3.0%, and poor customer service, also in 3.0%.
The listed patterns include reports about getting a car and its condition, alongside service complaints. They are each dataset’s leading entries, not a complete inventory of every issue mentioned.
What the combined findings reveal
Whole-review sentiment differs sharply across the analyzed datasets. Avis had the largest positive-review share, at 87%, while Budget had the smallest, at 11.5%. Budget also had the largest negative-review share, 86.5%, and Avis the smallest, 12.5%. Hertz had 54% negative and 44.5% positive reviews. These comparisons describe the analyzed datasets, not company-wide performance.
Individual claims add detail. Budget’s classified claims were 61.3% negative and 12.8% positive. Negative-claim shares for Alamo, Enterprise, and National ranged from 16.1% to 19.1%, while positive-claim shares for those three ranged from 60.3% to 60.9%. A whole review receives one overall sentiment label, even when it contains several positive or negative points, so claim-level and review-level shares need not match.
The topics assigned to negative reviews also vary. Product and service quality appeared in 51.6% of Enterprise’s negative reviews, the highest comparable share in the supplied findings, versus 8.0% for Avis. Speed and efficiency appeared in 48.0% of Avis’s and 27.7% of Budget’s negative reviews, compared with 0% for Enterprise. One negative review can describe more than one issue, so topic percentages do not add up to 100%.
Positive patterns provide specific examples. Easy returns appeared in 13.0% of Enterprise reviews and 13.6% of National reviews. Clean vehicles appeared in 17.0% of Alamo reviews and 12.1% of National reviews. Listed negative patterns include poor vehicle condition for Hertz and low tire pressure for National.
Across the datasets, reported concerns include service pace, product and service quality, and vehicle condition. Customers also mentioned easy returns and clean vehicles positively. These findings describe analyzed feedback, not its causes or the experience of every renter.
Alamo Rent A Car: positive and negative experiences
In the Alamo Rent A Car dataset, 84.0% of reviews were positive, 13.5% negative, and 2.5% neutral. These shares summarize whole reviews. The leading patterns describe particular experiences in the dataset.
The most frequent positive pattern was an intention to rent from Alamo again, reported in 18.5% of reviews. Cleanliness appeared in 17.0% of reviews, and 9.5% included a positive impression of staff. The leading positive mentions cover both the vehicle and the service experience. Intending to rent again is a separate expression of satisfaction, not a verdict on every part of a rental.
General dissatisfaction, the leading negative pattern, appeared in 6.5% of reviews in the dataset. More specific vehicle-condition complaints included windshield wipers that did not work properly, in 1.5% of reviews, and wipers that left smears or streaks, also in 1.5%. These broad and specific reports do not establish what caused the problems.
Alamo’s positive-review share sits alongside customer reports of dissatisfaction and wiper problems. The findings describe feedback in this dataset, not a company ranking or population-wide performance.
Avis Car Rental: positive and negative experiences
In the Avis Car Rental dataset, 87.0% of reviews were positive, 12.5% negative, and 0.5% neutral. The leading positive pattern was highly favorable customer-service feedback, reflected in 13.5% of reviews. Two other leading positive patterns each appeared in 3.5% of reviews: recognition of Santa and favorable remarks about a named individual’s conduct.
The positive patterns combine a broad service assessment with specific personal references. Their order reflects the relative frequency of themes among classified claims, while the percentages describe the share of reviews mentioning each pattern.
Long lines appeared in 8.0% of reviews among the leading negative patterns. Strong dissatisfaction with an unpleasant experience appeared in 5.5%, as did a more general expression of dissatisfaction. By review share, long lines appeared more often than either of the other two entries, although the first-ranked pattern by claim frequency differs.
Positive customer-service assessments coexist in the Avis dataset with reports of long lines and broader dissatisfaction. These are patterns in the analyzed reviews, not evidence of causes or a judgment of Avis against other companies.
Budget Car Rental: positive and negative experiences
In the Budget Car Rental dataset, 86.5% of reviews were negative, 11.5% positive, and 2.0% neutral. Reviewers also described some positive experiences. They said the car was fine or praised it more generally, with each pattern appearing in 5.0% of reviews. Smooth, trouble-free drop-off appeared in 4.0%.
The leading negative patterns, ranked by their frequency among classified claims, concern dirty cars, strongly negative overall assessments, and delays before customers could get a usable car. By review share, these patterns appeared in 9.5%, 7.5%, and 10.0%, respectively. The delay pattern therefore has the largest review share of the three, although the ranking by claim frequency is different.
Some Budget reviewers found the car acceptable and the return smooth. Negative feedback includes complaints about vehicle cleanliness, service pace, and the overall experience. These findings describe reviews in the Budget dataset. They do not establish causes or how all customers experience the company.
Enterprise Rent-A-Car: positive and negative experiences
Easy returns were the leading positive pattern in the Enterprise Rent-A-Car dataset, appearing in 13.0% of reviews. Positive rental experiences appeared in 12.0% of reviews, and favorable overall assessments in 9.5%. These patterns pair a specific point in the rental process with broader approval of the experience.
The leading negative pattern was receiving a vehicle different from the one expected, reported in 3.5% of reviews. Inadequate windshield wipers appeared in 2.0% of reviews, and tire issues in 1.5%. These reports cover vehicle expectations and specific equipment or tire concerns. They do not establish how common those experiences are beyond this dataset.
Pattern rankings reflect the relative frequency of themes among classified claims, while the percentages describe reviews. The two measures are not interchangeable. Enterprise reviews include positive mentions of easy returns and negative reports about vehicle expectations or condition.
Hertz Car Rental: positive and negative experiences
Positive patterns in the Hertz Car Rental dataset include praise for staff, descriptions of a smooth process, and generally good assessments. Good experiences appeared in 8.0% of reviews. Positive impressions of staff and descriptions of a smooth process each appeared in 6.5%.
The negative patterns concern poor overall experiences, vehicle condition, and customer service. Poor experiences appeared in 8.0% of reviews, vehicle-condition concerns in 7.5%, and judgments of unacceptable customer service in 7.5%.
The pattern rankings reflect the relative frequency of themes among classified claims, while the percentages describe the share of reviews associated with each pattern. Favorable mentions of staff and a smooth process coexist in the dataset with reported service dissatisfaction and vehicle concerns. The findings do not show whether the same reviewers reported both. These are patterns in Hertz’s analyzed feedback, not evidence of their causes or a verdict on the company relative to other providers.
Dirty or filthy cars appeared in 7.0% of reviews in the Hertz dataset, among the prominent negative patterns. Together with the reported concerns about vehicle condition and customer service, this adds detail to the range of feedback beyond a single overall sentiment label.
National Car Rental: positive and negative experiences
Easy returns were the leading positive pattern in the National Car Rental dataset, appearing in 13.6% of reviews. Clean vehicles appeared in 12.1%, and positive descriptions of service in 11.1%. Customers mentioned convenience, cleanliness, and favorable service impressions in positive feedback.
A reported problem with the rental car was the most common leading negative pattern, appearing in 7.0% of reviews. Low tire pressure appeared in 3.0% of reviews, as did poor customer service. These examples include both a vehicle-condition issue and criticism of the service experience.
Positive reports of easy returns and clean cars sit alongside reports of vehicle problems and poor service in the National dataset. The percentages describe the share of reviews associated with each pattern, not the share of individual claims. The specific patterns add detail to the overall impressions in the analyzed datasets.
What the findings add up to
Whole-review sentiment ranges from 11.5% positive in the Budget Car Rental dataset to 87.0% in Avis Car Rental. Negative sentiment ranges from 12.5% in Avis to 86.5% in Budget. Hertz had 54.0% negative and 44.5% positive reviews. These figures describe the analyzed datasets, not overall performance among all renters.
Claim-level sentiment gives another measure. Negative claims made up 61.3% of Budget’s classified claims, while positive claims made up 12.8%. Negative claims accounted for 16.1% in Alamo, 18.2% in Enterprise, and 19.1% in National. Claims and reviews are different units, so their percentages answer different questions.
Negative-review topics also differ across the datasets. Product and service quality appeared in 51.6% of Enterprise’s negative reviews and 8.0% of Avis’s. Speed and efficiency appeared in 48.0% of Avis’s and 27.7% of Budget’s negative reviews. A review can describe more than one issue.
Positive mentions included easy returns for Enterprise and National, and clean vehicles for Alamo and National. Negative examples included delays and dirty cars in Budget reviews, plus reports about wipers, tire pressure, or vehicle condition in reviews of Alamo, Enterprise, National, and Hertz. These patterns describe reported feedback without establishing causes or population-wide performance.
The findings point to differing overall impressions and recurring reports about service pace, product and service quality, and vehicle condition, alongside positive accounts of returns and cleanliness. This study does not rank companies or their branches. It helps companies identify reported gaps in product and service quality so they can improve them.
Figures come from the analyzed public-review datasets. Overall review sentiment and sentiment within individual claims use separate denominators.
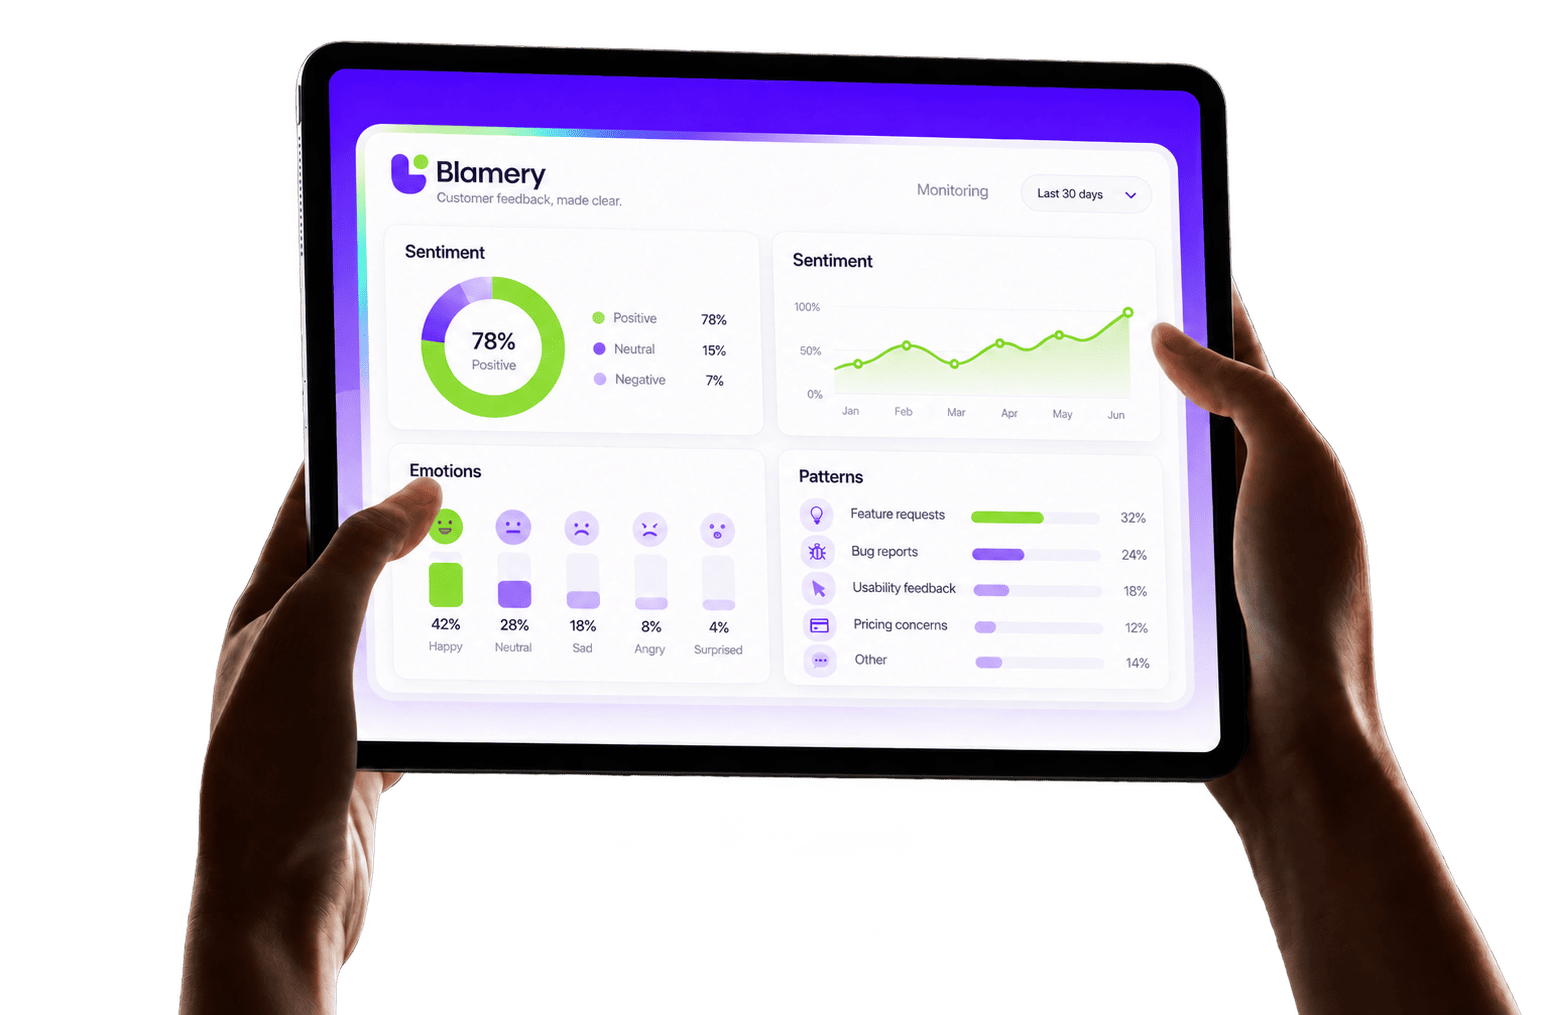
Blamery can run sentiment analysis and identify positive and negative patterns in public online feedback about your company or product, as well as competing companies or products. Explore the free demo, or contact us for custom marketing research.