


We studied publicly available online reviews of car rental companies serving LaGuardia Airport in East Elmhurst, Queens, New York City. We collected the reviews in November 2026 and included ACE Rent A Car, Avis Car Rental, Budget Car Rental, Drivo Rent A Car, and Enterprise Rent-A-Car because we found at least 3,000 reviews for each company. We did not establish when the reviews were published.
Our research examines which reported experiences shape customer perceptions and which concerns recur across companies or differ between them. An overall sentiment label makes a review look tidier than the customer account it summarizes. We compare sentiment assigned to whole reviews with sentiment assigned to individual claims, then examine recurring praise and complaints involving staff interactions, speed, problem resolution, billing, waiting, and vehicle readiness. The aim is to understand customer perception, not to name a winning provider.
Overall review sentiment across the researched datasets
Whole-review sentiment gives a broad sense of the tone assigned to a review. It compresses each review into one label and does not show the experience behind that label.
Avis reviews had the highest positive share among the five datasets, at 81.0%. Budget reviews had the lowest, at 45.7%. Negative sentiment appeared in 53.3% of Budget reviews, the highest share, and 18.5% of Avis reviews, the lowest.
Positive sentiment appeared in 73.0% of Enterprise reviews and 64.0% of ACE reviews. Negative sentiment appeared in 25.0% of Enterprise reviews and 34.5% of ACE reviews. Drivo reviews were close to an even split: 49.5% were positive and 49.0% negative. Neutral sentiment ranged from 0.5% of Avis reviews to 2.0% of Enterprise reviews.
These figures describe the analyzed datasets, not all customers or independently measured service quality. A single review label also obscures the specific praise and concerns in customer accounts, so we examined individual claims and recurring themes as well.
Sentiment within individual customer claims
A review can contain several claims, including both praise and criticism. Claim-level percentages describe the sentiment assigned to classified claims, not the percentage of customers who felt a particular way. Their denominator is claims rather than reviews, so these figures answer a different question from whole-review sentiment.
Positive claims made up 62.1% of Avis’s classified claims and 52.8% of Enterprise’s. Negative claims were less common in those datasets, at 22.6% for Avis and 27.3% for Enterprise.
Negative claims accounted for 48.1% of Budget’s classified claims and 48.9% of Drivo’s, compared with positive shares of 29.6% and 26.2%, respectively. ACE also had a higher negative than positive claim share: 41.7% versus 36.5%.
Drivo had the highest negative-claim share and the lowest positive-claim share across these datasets. Avis had the highest positive share and the lowest negative share. Neutral claims ranged from 15.3% for Avis to 25.0% for Drivo.
The claim-level figures describe a different mix from the whole-review labels. They compare the analyzed datasets and do not rank providers or predict an individual rental experience.
Complaint topics across the researched datasets
Negative reviews of the five companies raised different kinds of reported friction. The percentages give the share of negative reviews in each dataset that mentioned a topic.
Speed and efficiency appeared in 45.3% of Budget’s negative reviews, compared with 27.0% of Avis’s, 18.8% of ACE’s, 14.0% of Enterprise’s, and 6.1% of Drivo’s. Problem resolution was Drivo’s leading negative-review topic, appearing in 35.7% of its negative reviews. The comparable shares ranged from 16.0% for Enterprise to 24.3% for Avis.
Support-related complaints appeared in 34.0% of Enterprise’s negative reviews and 2.7% of Avis’s. The other three companies’ shares ranged from 7.1% to 10.1%. Product and service quality appeared in 21.7% of Budget’s negative reviews and 18.0% of Enterprise’s.
The topics that appeared in negative reviews varied across company datasets. A review can mention more than one issue, so topic shares do not add up to a single total. These comparisons describe the analyzed datasets and do not establish broader differences in service quality.
Top positive patterns by company
The positive-pattern summaries rank patterns by reported claim counts. The percentages in this section refer to reviews in each company’s dataset, not individual claims.
Customer-service praise appeared in 11.0% of Avis reviews, alongside a separate positive evaluation of the service in 10.5%. Enterprise reviews also included customer-service praise in 11.0% of cases, as well as favorable vehicle descriptions in 9.5%. For ACE, favorable mentions of Omar appeared in 6.5% of reviews, and praise for Dip’s customer service appeared in 7.0%. These findings show service-related praise across several datasets, but do not establish that the experiences or people mentioned were the same.
For Drivo, a generally positive experience appeared in 10.5% of reviews, and favorable descriptions of Orlando’s service appeared in 8.5%. Budget’s broad positive-experience pattern appeared in 10.1% of reviews. Other leading Budget patterns included favorable descriptions of Sabrina’s manner and assistance in 3.5% of reviews, and positive evaluations of Sarai in 3.0%. The patterns range from general approval to service praise, vehicle impressions, and mentions of individuals.
Across the analyzed datasets, favorable reviews describe different experiences, including service, general satisfaction, and vehicles.
Top negative patterns by company
The negative-pattern summaries rank each company’s patterns by reported claim counts. Percentages refer to the share of reviews in each company’s dataset that mentioned a pattern.
ACE’s leading patterns were additional charges, poor service, and strongly negative descriptions. Each appeared in 7.5% of reviews in its dataset. Avis’s leading patterns were broad negative descriptions: 5.0% of reviews described the service negatively, another 5.0% characterized the experience as exceptionally bad, and 4.5% described feeling in a bind, including being stranded.
Drivo’s most common negative pattern was reviewers advising against using the company, which appeared in 11.5% of reviews. Unfavorable experience descriptions appeared in 9.5%, and charges above the expected or base amount in 9.0%. Cost concerns appear among the leading patterns for both Drivo and ACE. ACE’s pattern concerns additional charges, while Drivo’s specifies charges above the expected or base amount.
Budget’s leading patterns were waiting, dirty vehicles, and slow service. Waiting appeared in 9.5% of reviews, while reports of dirty vehicles and slow service each appeared in 7.5%. Enterprise’s leading patterns were strongly negative descriptions (7.5%), disappointment (6.0%), and frustration (5.0%).
These summaries cover each cohort’s three leading patterns, not every concern in its reviews. A pattern’s absence from this list does not mean it was absent from the dataset. Some leading patterns name concrete concerns such as waiting, vehicle condition, or charges. Others describe negative judgments more broadly.
What the combined findings reveal
Whole-review sentiment differed across the analyzed datasets. Avis reviews were 81.0% positive and 18.5% negative, while Budget reviews were 45.7% positive and 53.3% negative. These overall shares describe the tone of each dataset, but do not explain what drove each review or establish service quality.
Individual claims add detail because one review can contain several observations, including praise and criticism. Positive claims made up 62.1% of Avis’s classified claims and 52.8% of Enterprise’s. Negative claims accounted for 48.1% of Budget’s and 48.9% of Drivo’s. These are claim-level shares, not review-level percentages, and the two measures are not interchangeable.
Negative-review topics differed as well. Speed and efficiency appeared in 45.3% of Budget’s negative reviews and 27.0% of Avis’s. Problem resolution appeared in 35.7% of Drivo’s negative reviews. Support-related complaints appeared in 34.0% of Enterprise’s negative reviews, compared with 2.7% of Avis’s. A negative review can describe more than one issue, so topic shares need not total 100%.
Customer-service praise appeared in 11.0% of both Avis and Enterprise reviews, and in 7.0% of ACE reviews. Billing concerns featured among ACE’s and Drivo’s leading negative patterns. Budget’s leading complaints included waiting, slow service, and dirty vehicles. Together, these measures describe different parts of customer perception across the five analyzed datasets.
ACE Rent A Car: positive and negative experiences
In ACE Rent A Car’s dataset, leading positive patterns include customer-service praise attributed to Dip in 7.0% of reviews, positive regard for Omar in 6.5%, and a favorable assessment of Dip in 6.5%. These percentages are review shares, not claim shares, and the labels do not establish the individuals’ roles.
Broader positive patterns include favorable descriptions of customer service in 9.5% of reviews and reports that the process or transaction was easy in 9.0%. The dataset’s positive accounts therefore include both interpersonal impressions and reports of an easy transaction.
Positive sentiment applied to 64.0% of ACE reviews and negative sentiment to 34.5%. At the claim level, negative claims made up 41.7% and positive claims 36.5%. A review can contain several assessments, so whole-review tone and the balance of its component claims describe different units.
Three negative patterns shared the top rank in the summary: additional charges that increased the bill, poor service, and strongly negative assessments of the experience. Each appeared in 7.5% of reviews in ACE’s dataset. The leading themes include a specific billing concern alongside broad dissatisfaction.
ACE reviews include praise for service and an easy transaction, as well as complaints about charges and poor experiences. The pattern summaries describe themes across the dataset, not a single customer journey.
Avis Car Rental: positive and negative experiences
In Avis Car Rental’s dataset, 81.0% of reviews were positive, 18.5% negative, and 0.5% neutral. The overall tone leaned positive, while the reviews also included a distinct body of criticism.
The two leading positive patterns concerned customer service, and each appeared in 11.0% of reviews. A general positive evaluation of the service appeared in 10.5% of reviews. Customer service and broader satisfaction were prominent sources of praise in this dataset.
General descriptions of poor service and exceptionally bad experiences each appeared in 5.0% of reviews. Another leading pattern, appearing in 4.5% of reviews, described feeling in a bind, including being stranded. The summaries pair broad dissatisfaction with reports of being left in a difficult situation. They do not point to one specific operational cause.
These percentages describe the share of reviews that included each theme. The patterns are ordered by reported claim counts, while the percentages use reviews as their denominator. Avis’s positive service themes and negative reports of poor or difficult experiences show the range of customer perceptions in this cohort.
Budget Car Rental: positive and negative experiences
Budget Car Rental’s leading positive pattern was a generally favorable description of the experience, appearing in 10.1% of reviews in this dataset. The next two ranked patterns were favorable assessments of Sabrina’s manner and assistance, in 3.5% of reviews, and a favorable evaluation of Sarai, in 3.0%. The patterns pair broad approval with praise tied to named individuals, without establishing their roles.
The pattern summaries rank entries by reported claim count, while the percentages describe the share of reviews associated with each pattern. Waiting ranked below vehicle cleanliness by claim count, yet appeared in 9.5% of reviews, compared with 7.5% for reports of a dirty car.
Budget’s three leading negative patterns concern vehicle condition and the pickup experience: reports of a dirty car, customers left waiting, and slow service. Slow service and dirty vehicles each appeared in 7.5% of reviews, while waiting appeared in 9.5%. Other pattern summaries describe long lines and prolonged waits to receive or pick up a car, adding detail to the waiting theme in this dataset.
Budget’s positive assessments sit alongside complaints about vehicle readiness, service speed, and waiting. These patterns describe reported experiences in the analyzed dataset, not a provider ranking.
Drivo Rent A Car: positive and negative experiences
Drivo Rent A Car’s leading positive patterns include generally positive experiences in 10.5% of reviews and good-service descriptions in 8.5%. Another leading pattern, a positive view of a named individual, appeared in 10.5% of reviews. The label does not establish that person’s role. These percentages describe reviews associated with each pattern, while reported claim counts use a different unit.
Drivo’s leading negative patterns move from general dissatisfaction to specific consequences. In 11.5% of reviews, customers advised against using the company. Unfavorable experience descriptions appeared in 9.5%, and charges above the expected or base amount in 9.0%. The leading complaints include both broad rejection and a specific billing concern.
Favorable service assessments appear among Drivo’s leading positive patterns, while recommendations against the company rank first among its negative patterns. The billing pattern adds a specific concern to those broader judgments. The summaries identify patterns in reviews. They do not establish why experiences occurred or show that every reviewer encountered the same issues. The pattern lists cover the three highest-ranked themes, so an unlisted theme should not be read as absent.
Drivo’s whole-review shares were nearly even, while its individual claims had a different distribution. The two measures use different units and are not interchangeable. The positive service accounts and sharp negative assessments add detail to the customer perceptions in this dataset.
Enterprise Rent-A-Car: positive and negative experiences
Enterprise Rent-A-Car’s leading positive pattern was customer-service praise, followed by positive overall experiences and favorable vehicle descriptions. Customer-service praise appeared in 11.0% of reviews, and each of the next two patterns appeared in 9.5%. These are review shares. The patterns’ order reflects reported claim counts.
Enterprise’s leading negative pattern was strongly negative descriptions of the experience. Expressions of disappointment or frustration and descriptions of a disappointing rental followed in reported claim-count rank. The patterns appeared in 7.5%, 5.0%, and 6.0% of reviews, respectively. The third pattern had a larger review share than the second despite its lower rank by reported claim count.
Customer-service praise leads Enterprise’s positive patterns, while its leading negative patterns describe dissatisfaction in broad terms rather than one specific service issue. Whole-review sentiment captures both sides: 73.0% of Enterprise reviews were positive and 25.0% negative. The praise and criticism appear as distinct patterns within the same company cohort.
What the findings add up to
Whole-review sentiment leaned positive in Avis’s dataset, where 81.0% of reviews were positive. In Budget’s dataset, 53.3% of reviews were negative. These figures describe differences among the analyzed datasets, not a ranking of service quality.
Individual claims offer a separate view. Positive claims made up 62.1% of Avis’s classified claims and 52.8% of Enterprise’s. Negative claims made up 48.1% of Budget’s and 48.9% of Drivo’s. Because a review can contain multiple claims, including both praise and criticism, claim-level shares cannot be read as whole-review sentiment.
Reported concerns also varied. Speed and efficiency appeared in a larger share of Budget’s negative reviews than Avis’s, and problem resolution was prominent in Drivo’s negative reviews. Customer-service praise featured among the leading positive patterns for Avis, Enterprise, and ACE. Budget’s leading complaints included waiting, slow service, and vehicle cleanliness. Unexpected charges appeared among ACE’s and Drivo’s leading negative patterns. These measures describe different aspects of customer perception across the five company datasets.
This study does not rank companies or their branches. It helps companies identify reported gaps in product and service quality for improvement.
Figures come from the analyzed public-review datasets. Overall review sentiment and sentiment within individual claims use separate denominators.
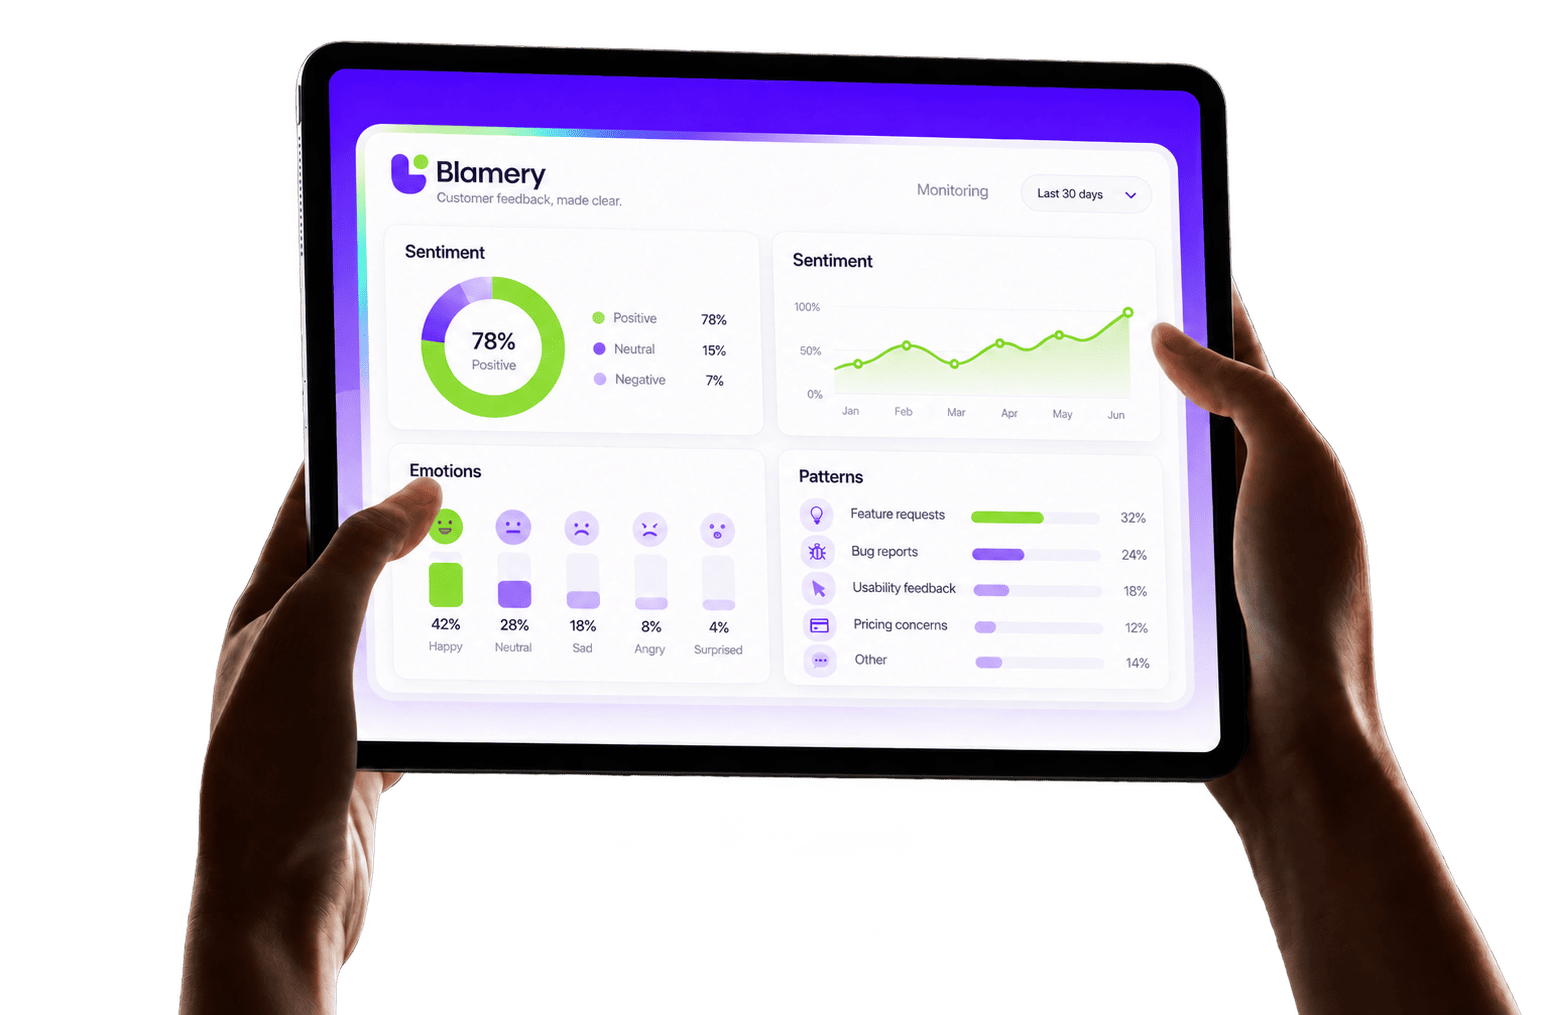
Blamery can run sentiment analysis and identify positive and negative patterns in public online feedback about your company or product, as well as competing companies or products. Explore the free demo, or contact us for custom marketing research.